Investment potential of the region
Geographical advantages and transportation infrastructure
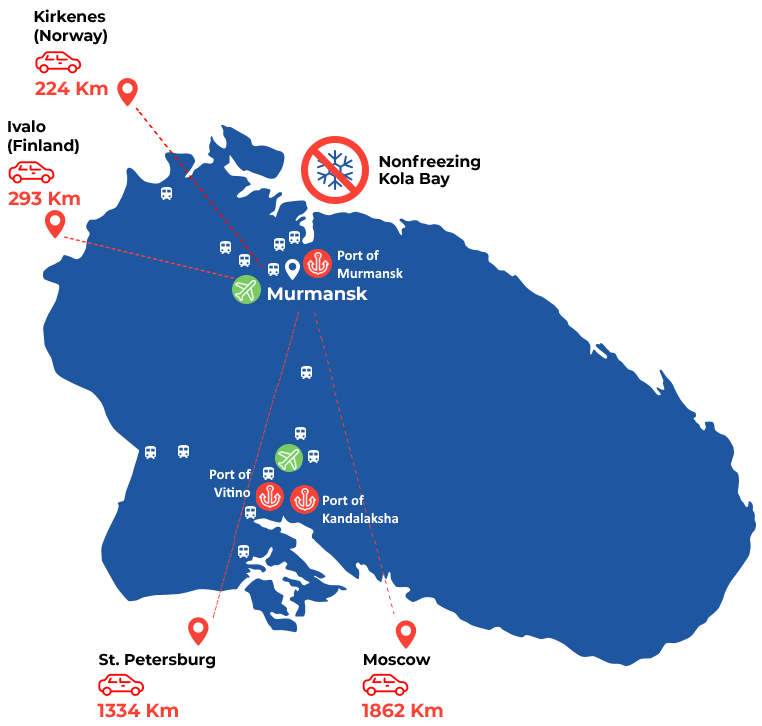
Marine transportation and ship repair
7% of the total Russian volume of transportation of cargoes by sea transport
Sea port of Murmansk
Repair
The largest industrial enterprises
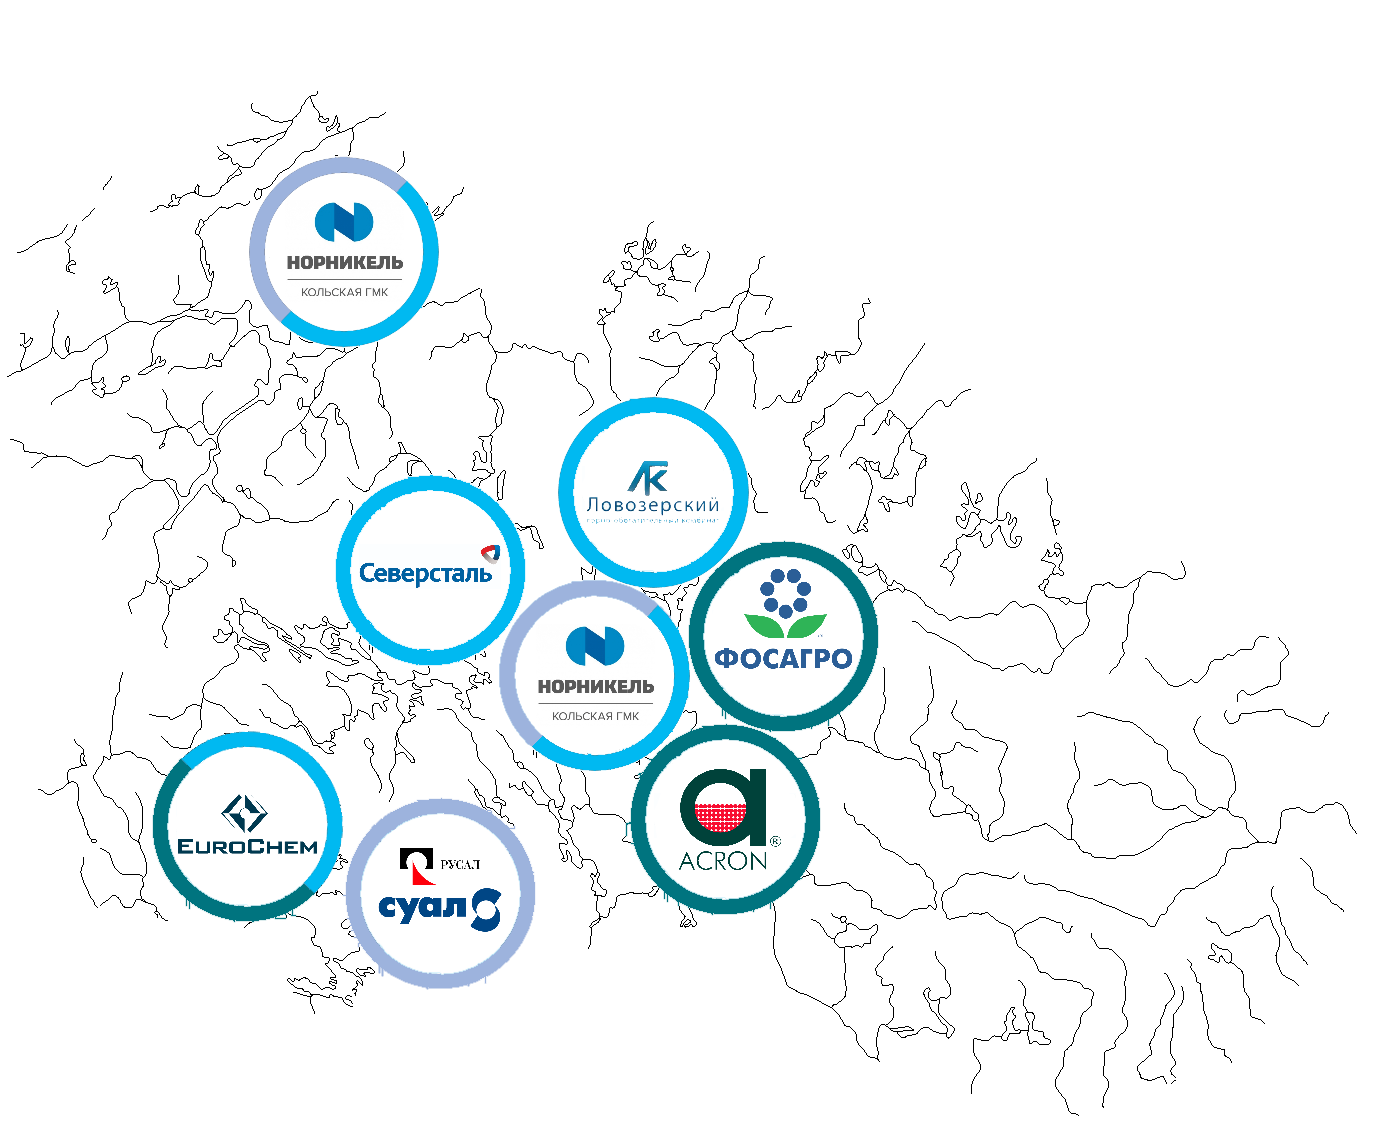
THE SHARE OF MURMANSK REGION IN INDUSTRIAL PRODUCTION OF RUSSIA
100%
loparite concentrate
100%
Apatite and nepheline concentrates
95%
Nickel
8%
zhelezorudnogo concentrate
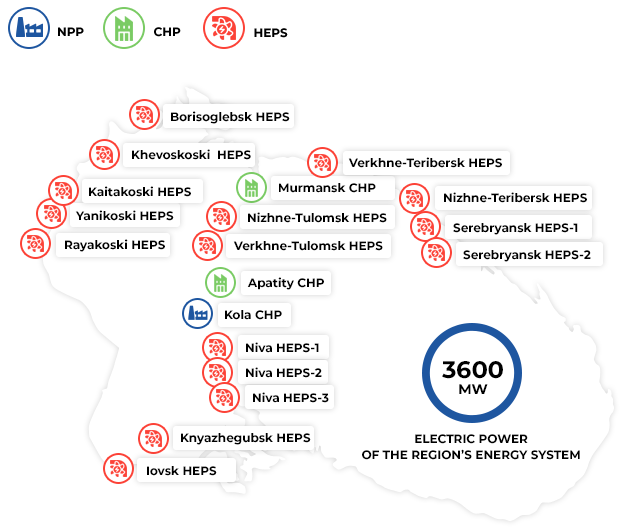
The energy potential of the region


Tourism potential of the region
>800 thousand tourists annually visit the region
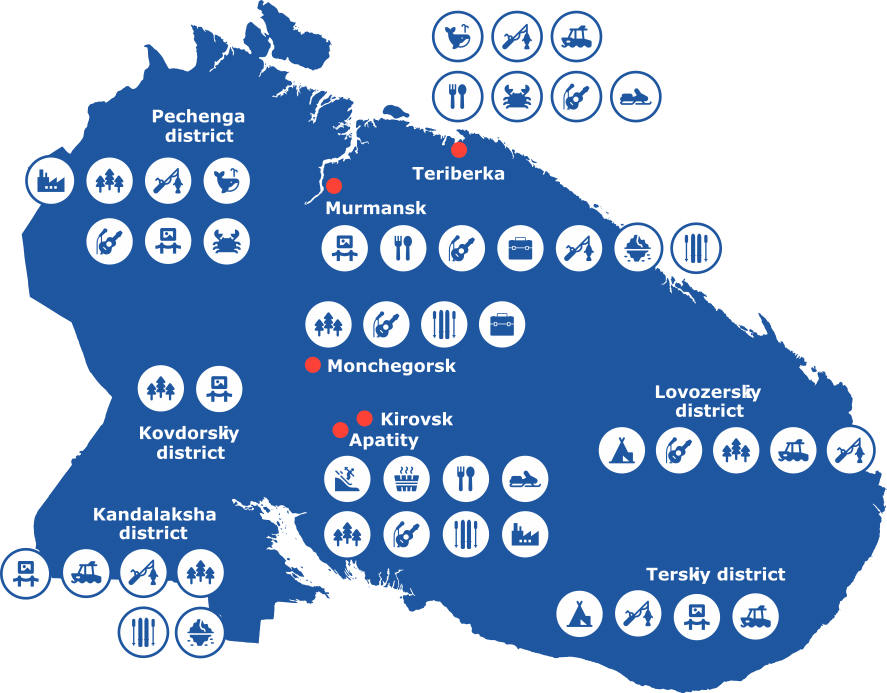
Unique natural objects
- Tundra
- Seidozero
- Rybachy and Sredny Peninsulas
- Teriberka
- Khibiny Mountains
- Lapland Nature Reserve
- Kandalaksha Nature Reserve
- Nature Reserve "Pasvik"
Basic kinds of tourism
-
Skiing

-
Fishing

-
Sports tourism

-
History & culture

-
Indigenous people

-
Events

-
Industrial

-
Nature

-
Local food

-
Business travel

-
Water activities

-
Autotourism

-
Snowmobile safari

-
Health tourism

-
Whale hunting photos

-
Ice floating

-
Crab safari

A unique natural phenomenon
main economic indicators (2024)